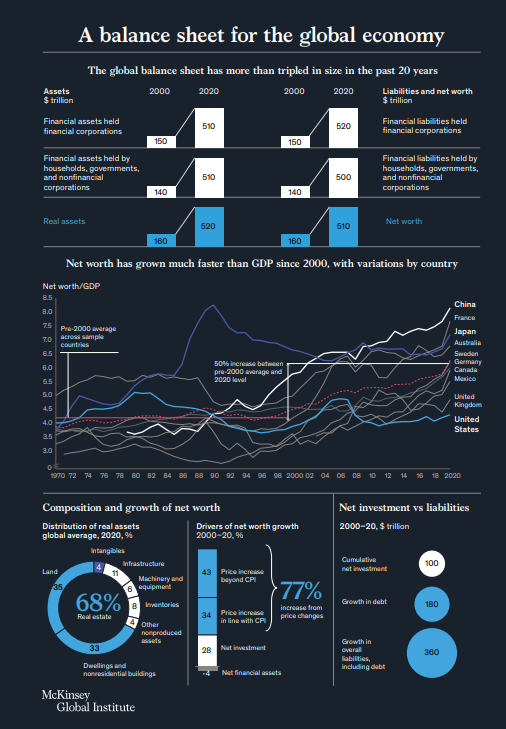
While the state of economies is usually measured by GDP or other metrics of economic flows, this research examines the balance sheets of ten countries representing more than 60 percent of global income: Australia, Canada, China, France, Germany, Japan, Mexico, Sweden, the United Kingdom, and the United States. This view highlights a dual paradox: bricks and mortar make up most of net worth, even as economies turn digital and intangible, and balance sheets have expanded rapidly over the past two decades, even as economic growth has been tepid. How countries and companies adjust to this divergence between wealth and GDP, find 21st-century stores of value, and address growing financial imbalances will determine the future course of the global economy and our wealth.
Key finding are:
- The market value of the global balance sheet tripled in the first two decades of this century.
- The world has never been wealthier, with large variations across countries, sectors, and households.
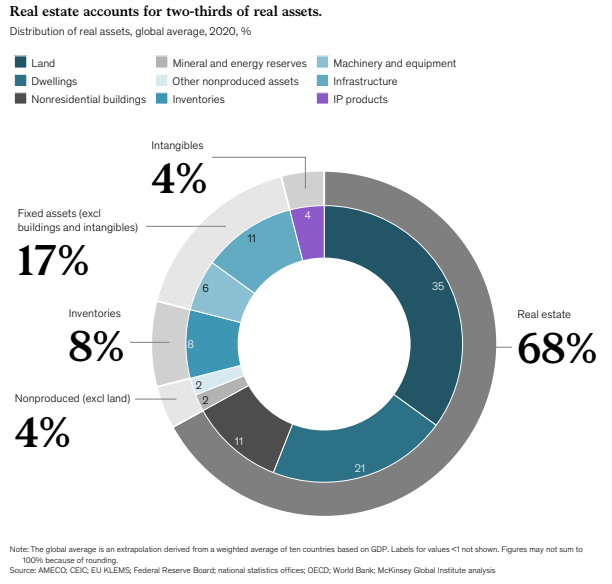
- Two-thirds of global net worth is stored in real estate and only about 20 percent in other fixed assets, raising questions about whether societies store their wealth productively
- Asset values are now nearly 50 percent higher than the long-run average relative to income.
- For every $1 in net new investment, the global economy created almost $2 in new debt
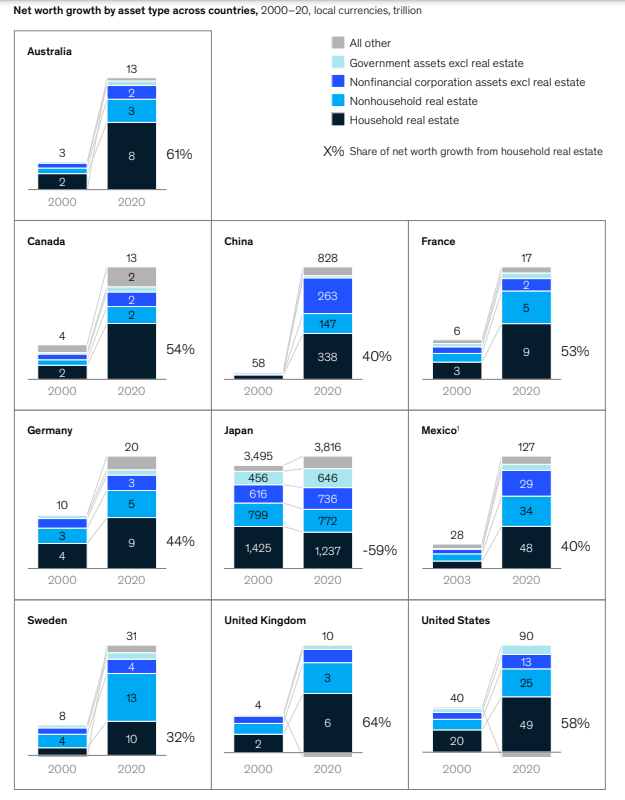
Household real estate drove 32 to 64 percent of net worth growth in all countries except Japan, reflecting rising values compared to rents. The escalating value of housing, particularly in high-growth superstar cities where GDP per capita is 45 percent higher than elsewhere, contributed to increasing net worth across the ten countries. In Australia, Canada, France, the United Kingdom, and the United States, household real estate was responsible for at least 50 percent of growth in net worth (Exhibit 30). History suggests that today’s real estate prices are elevated relative to long-term trends (see Box 4, “Real estate prices also seem elevated from a long-term historical perspective”).
After household real estate, the next-largest contributor to national net worth growth was corporate and public real estate, accounting for 15 to 42 percent in all countries apart from Japan. Beyond real estate, other productive assets also had a role in growing net worth, particularly in China and Mexico, which are in a relatively earlier stage of economic development than the other countries in our sample, and in Japan. In China, Japan, and Mexico, productive assets of non-financial corporations, for example, machinery and equipment, inventories, and infrastructure, grew much faster than GDP and accounted for more than 20 percent of net worth growth. In China, although household real estate wealth grew the most in absolute terms and thus contributed the most to absolute net worth growth, productive assets of non-financial corporations and government had the fastest growth rates, greatly exceeding the country’s GDP growth.
As a result, the divergence between China’s net worth and GDP is primarily attributable to those assets rather than to real estate. Other countries saw productive assets of non-financial corporations mostly move in line with GDP. Japan’s net worth grew due to substantial public investment. Real estate stock contracted as prices declined, but productive assets, particularly in the government sector, increased. Japan’s net worth thus grew primarily as a result of net investment. Increasing net investment by the corporate and government sectors effectively offset the negative impact of lower real estate prices. In 2020, public infrastructure in Japan had a value relative to GDP that was 5.2 times higher than the average in the other countries in our sample.
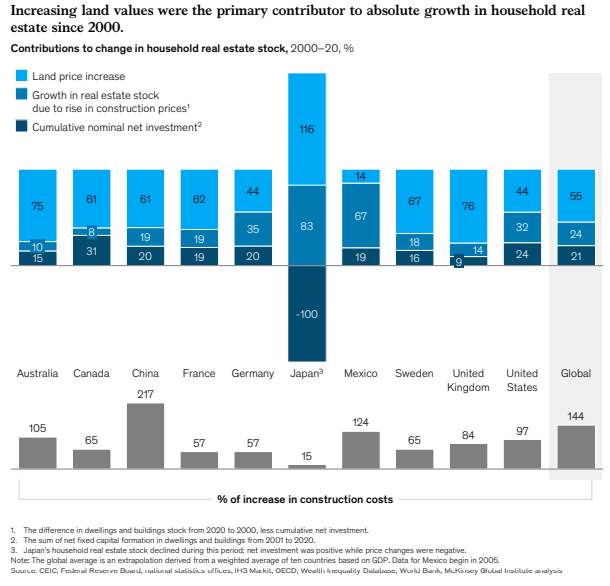
Growth in household real estate wealth stemmed from rising home prices, with the cost of land and construction also increasing Household real estate value may grow because of increased investment that expands the actual quantity or quality of real estate stocks or because of rising market prices. All countries other than Japan saw total household real estate values grow more as a result of price increases than of the creation of a greater quantity of real estate (Exhibit 32).
Net investment in new real estate stock accounted for 9 to 31 percent of the growth of household real estate values in our sample of countries excluding Japan, or 21 percent on average. Canada was at the top of the range, with net investment contributing 31 percent to higher household real estate wealth, while the United Kingdom was at the low end, with a 9 percent increase in household real estate wealth attributable to net investment. In relation to GDP, China had the highest levels of net investment in household real estate, at 8 percent of GDP on average, followed by Canada and Australia at 5 and 4 percent, respectively. Home prices, in turn, have more than doubled in nominal terms over the past two decades across all ten countries apart from Japan, which saw declining prices, and Germany, where home prices begin to climb only after 2010. Home prices reflect the prices of land and structures.
The most significant driver of household real estate stock growth from 2000 to 2020 was rising land prices, accounting for more than half of the increased value of global household real estate, and about 75 percent of growth in Australia and the United Kingdom. On the lower end, Germany, Mexico, and the United States saw less than 50 percent of the increase in household real estate wealth from increasing land prices. In many countries, land supply is limited by zoning policies and so is fairly inelastic to price increases. Escalating construction costs contributed an average of 24 percent to rising real estate values. Construction costs have increased across countries since 2000, at the high end rising over 200 percent in China, or roughly two and four times faster than general inflation, respectively. In all countries in our data, construction costs grew by 144 percent, or 2.7 times general inflation. Construction prices even rose in Japan by 15 percent, which was relatively high for a country with just 3 percent general inflation from 2000 to 2020.
In inelastic land and real estate markets, declining rental yields led to home price growth in many countries. Home prices can be seen through the lens of expected rental income or, in the case of owner-occupied real estate, an implied rental value, and rental yields, which are the inverse of value-rent multiples. Rental yields are a proxy for capitalization rates, which are more commonly used in the real estate industry to determine the value of real estate given expected rental income streams. Capitalization rates are primarily driven by long-term interest rates but are also a function of expected rent growth, ease of financing, the tax environment, and investment substitutes. In addition, expectations about price appreciation in housing markets tend to be extrapolative, potentially leading to values difficult to justify by fundamentals.
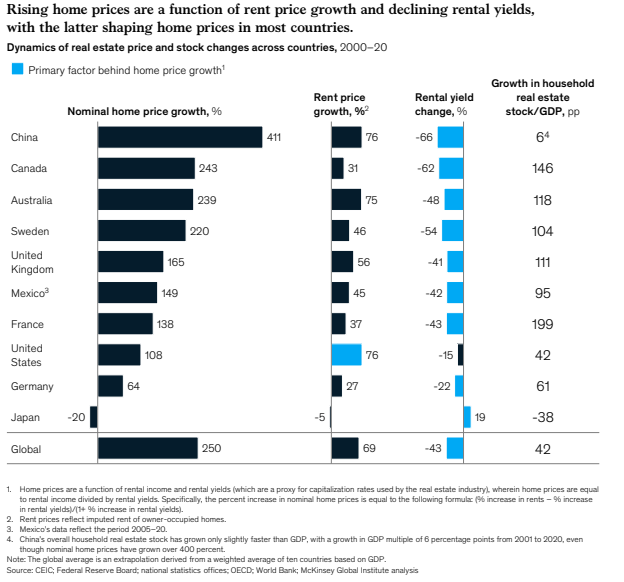
As rental yields and interest rates declined, notable supply inelasticity of real estate and land markets in most of the ten countries meant that prices rose fast and rents increased, too, although more moderately. Had those markets been more elastic, we might instead have seen a rapid pickup in investment activity and growth in floor space, which would have dampened price increases and led to steady or declining rents. The OECD has noted that areas with higher supply elasticity will see more rapid swings in housing investment in response to changes in prices. For example, in the United Kingdom, which the OECD describes as a relatively more rigid housing market, home prices grew 165 percent from 2000 to 2020. In the United States, which the OECD places among the most elastic housing markets, home price growth was 108 percent, one of the lowest rates across our ten countries.
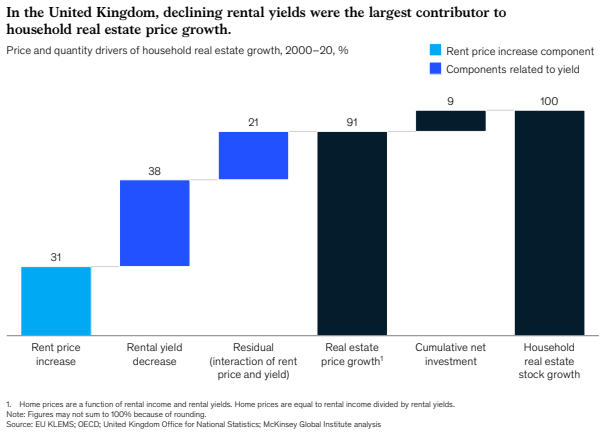
In the United Kingdom, as home prices rose, rent prices grew 56 percent, while rental yields decreased by 41 percent. Seen altogether, rent price increases and declining rental yields contributed 31 and 38 percent, respectively, to household real estate stock growth; the interaction between the two contributed 21 percent, and cumulative net investment contributed the remaining 9 percent (Exhibit 33). This high impact of declining rental yields on home prices held true across most countries (Exhibit 34). Japan was an outlier, as was Germany, with more muted home price growth. The United States had more impact from rent increases. For instance, rent increases totalling 76 percent contributed overwhelmingly to home price growth, compared with a decrease in rental yields of 15 percent. As in other countries, interest rates have declined in the United States in recent decades, but tighter lending standards for mortgages imposed after the 2008 financial crisis put some brakes on the single-family housing market. Outside superstar cities in the United States, real estate markets are more elastic than elsewhere. Prices began rising again in the United States starting in 2012, posting particularly strong growth from 2019 to 2020—at 8 percent, faster than the other countries.
Canada and France saw the fastest growth of household housing wealth relative to GDP. Canada’s household real estate stock relative to GDP increased by 1.5 times GDP, and France’s increased by nearly double GDP. Declining rental yields made the biggest contribution to higher housing prices in Canada, accounting for about two-thirds of the price increase. Booming demand and favorable taxation of property gains supported Canada’s market. French housing prices saw the bulk of their growth in the early 2000s and have mostly stabilized since. That pattern coincides with the adoption of the euro, which was followed by a downward shift in interest rates, although additional factors may have been at play.